Interactive Maps and Custom PDFs
Interactive Maps and Custom PDFs
We were tasked recently with creating an interactive map that would:
- Work across desktops and mobile devices.
- Allow a visitor to compare details between different countries.
- Print out custom PDFs of that comparison.
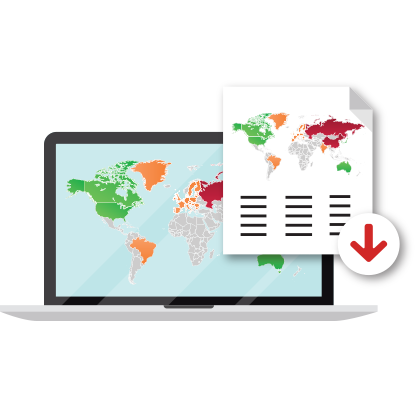
 Same SVG image, different sizes
First, we converted an illustration of the world into SVG data. SVG, or Scalable Vector Graphics, uses math to define graphics that can then be drawn at any size without losing quality. We leveraged the vector graphics drawing library, Raphael, to draw each country on the map and used JavaScript to control zooming and dragging.
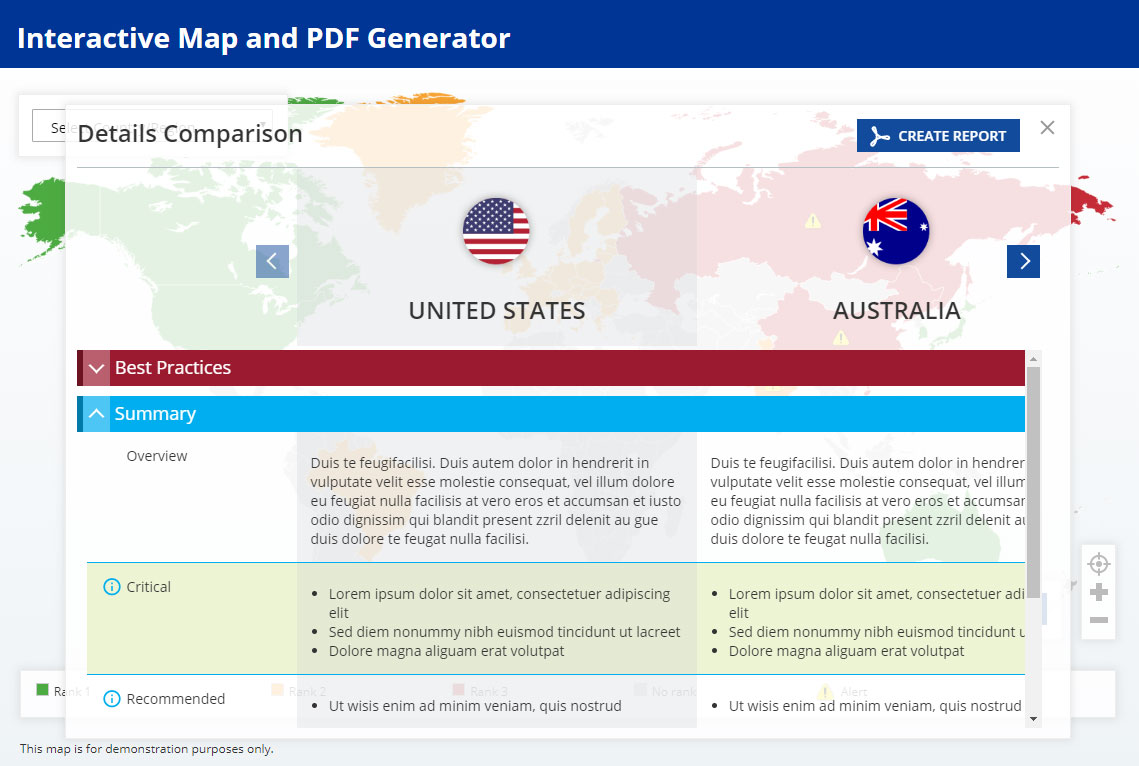
Countries with details were wired as clickable objects. We used JavaScript to display a quick blurb on the selected country and show options to see all the details for that country or select it for comparison with other countries.
We showed single country details in a large, scrollable overlay. We also implemented collapsible content rows to help manage all the content. The comparison overlay displays multiple countries’ details side by side. The visitor can then print a PDF of all the countries they have selected.
Custom PDFs with PHP
To keep maintenance manageable, we stored all of the countries’ details in PHP and dynamically wrote it into JavaScript on page load. When a visitor requests a PDF, they are simply submitting a list of IDs to PHP. That list is then used to build the PDF on demand.
We turned to the FPDF library to construct the PDF document. There was a lot of functionality built-in, but the library could also be heavily customized. We extended the FPDF class to define the custom look of the header and footer. The first page of the report consists of a map and mostly static information, but we also highlighted the countries on the map that were selected by the visitor. The rest of the report is made up of the details for each selected country. This is where we ran into trouble.
To keep data management simple, countries’ details were written using basic HTML tagging. This made it easy to display in browsers. But since the PDF format does not understand HTML, it was very hard to use directly in the PDF. We wrote an HTML processor for the PDF generator that converted all the HTML into native PDF elements. Nested bulleted lists were the hardest thing to implement.
In the end, we produced a stylish and engaging interactive that wowed our client and showcases our development prowess! Check out our demo of the interactive.